It’s been over a decade since I’ve had a statistics class and I’ve been feeling a little inadequate in my descriptive skills that I decided to brush up a bit with a Udacity Intro To Descriptive Statistics course. Much of this course was review and I got through it in about a week of watching videos and working through the examples. While it was review, it did help reinforce what I did know and fill a few gaps in my knowledge base.
The first lesson Intro to Statistical Research Methods does a nice job of covering the basics of the language to follow. Concepts like population, sample, operational definition, etc., form the foundation for the following lessons. While most of this should be common to anyone reading the news or casual scientific journals, truly understanding these and a handful of other terms is imperative to being precise with statistics. There are many ways to get tripped up with data, being precise with language is the only way we can communicate more advanced topics.
Lesson 2 Visualizing Data brings forth one of the most powerful aspects of statistics, conveying findings. This lesson covers frequency tables, proportions, bar charts, and histograms. We also get our first glimpse of a normal distribution and distributions skewed positively and negatively.
Following visualization we move into Lesson 3 with Central Tendency. The theme here is calculating MEDIAN, MODE, and MEAN values of a distribution. We also formalize the definition of a normal distribution where the MEDIAN \~= MODE \~= MEAN, and how to use the MEDIAN, MODE, and MEAN to determine if a distribution is positively or negatively skewed, when it isn’t normal.
Variability is Lesson 4, covering aspects like box plots, and whisker plots. Things also get a little spicier as you start to calculate standard deviations, including the Bessel’s Correction for a Sample’s Standard Deviation (hint, you divide by n-1 instead of n). There’s a lot of manually calculating standard deviations here, even though most of us know how to use the STDDEV function in Excell/Google Docs, it’s important to have a good grasp on what it means. For most of us, that means repetitive process. My recommendation is to just do it manually for the rest of this lesson, and the next, before you move onto using the built-in functions.
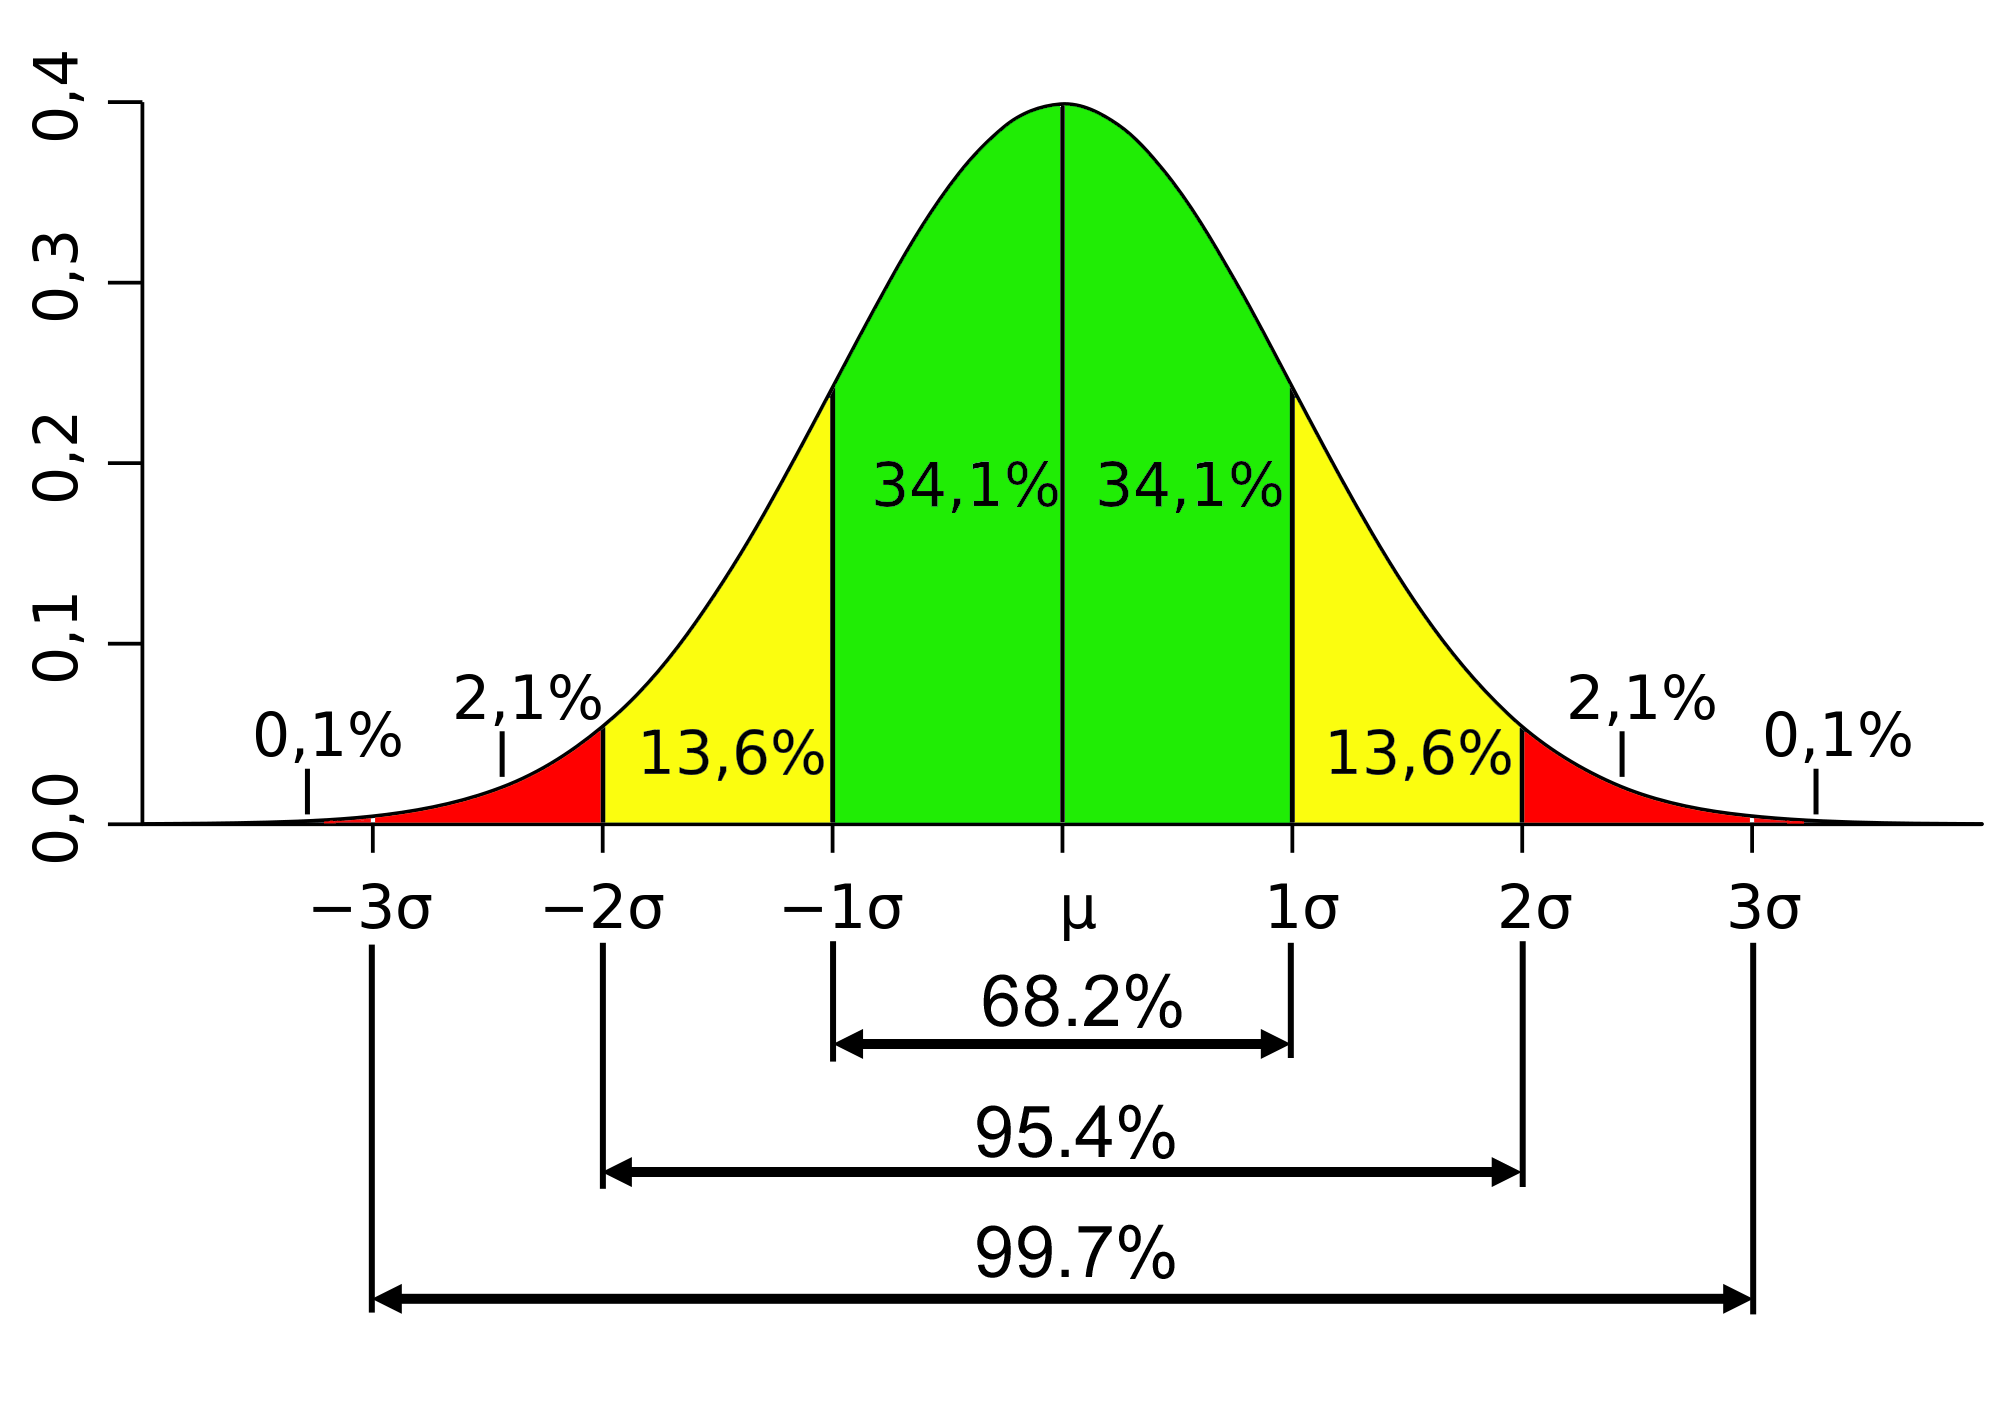
Lesson 5 got into Standardizing and honestly, I don’t remember this from college statistics at all. The idea here is that we take our normal distribution and convert it so that the area under the curve adds up to 1, which represents 100% probability. This is the basis for our Z-Score, which works to determine within how many standard deviations from the mean our sample falls, and with what probability we can expect these results.
With Lesson 6 we start to have a lot more fun with Normal Distributions. This lesson essentially builds on the previous ones, but reinforces the concept of the standard normal distribution with an area of 1, also known as a Probability Distribution Function or PDF (not to be mistaken for a Portable Document Format). Utilizing the Z-Score, which is calculated based on the Population Standard Deviation, Population Mean, and the Sample Mean, we can determine with how much probability we can expect our results.
We wrap up with Lesson 7 covering Sampling Distributions. This starts off with the all so important Central Limit Theorem, which is useful regardless of whether a distribution is normal or not. Essentially, 1) the MEAN of a Sample MEANs is approximately equal to the MEAN of the Population. 2) The Standard Deviation of the MEAN of Sample MEANs is equal to the Standard Error, and 3) the distribution of the Sample MEANs will become more normal as the number of Samples are taken.
For a free online class, these 7 lessons were a great refresher into the basics of descriptive statistics. I’ll be moving onto Inferential Statistics next. There’s something very fun about taking these classes as an adult for no other reason than to increase your own knowledge. I’ve always had a cynical eye on NEWS Statistics, reinforcing my basis of understanding just helps me quantify that cynicism.